
Ecommerce Performance Dashboard
The visualizations for the dashboard and the Sales, Product and Customer reports show important trends and figures, useful for answering some questions:
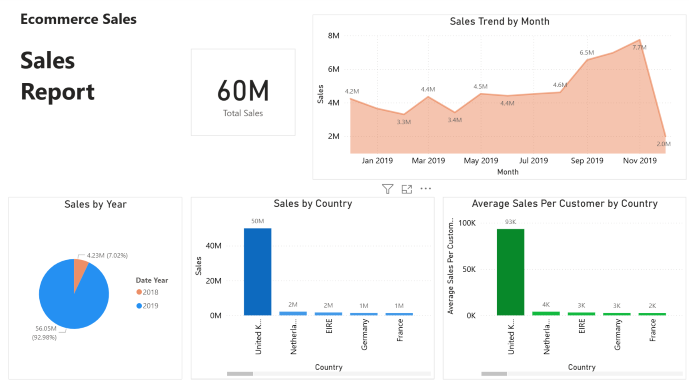
- How was the sales trend over the months?
- What are the most frequently purchased products?
- How was the sales amount by country?
- What are the most profitable segment customers?
Using the dashboard and the reports, we can monitor results and progress. By immediately having the right information available, correct decisions can be made.