Ecommerce Sales Analysis
- Explored the SQLite database and retrieved data in a Pandas dataframe
- Aggregated Sales by Date and Month to evaluate the overall and seasonal monthly trends
- Visualized the pivot table of monthly Sales by Product Category and explored the seasonal patterns of various products
- Grouped Sales by Payment Methods to see the most popular payment method by region
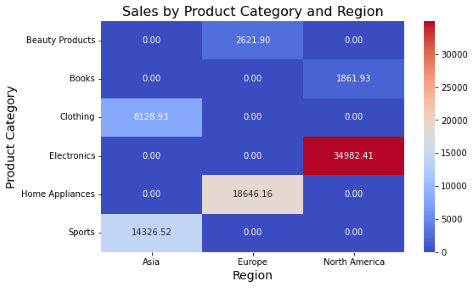
- Visualized the heatmap of Sales by Region to find the most popular product categories in each region
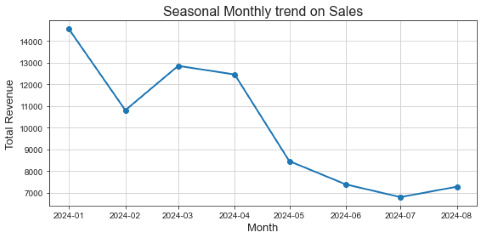
What is the monthly sales?
The monthly trend shows a decline in sales in January, followed by a good increase between February and April. Then, it continues to decrease to the lowest point in July then start to pick up again in August.
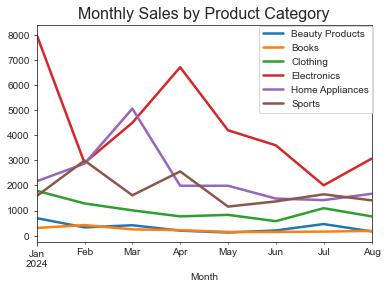
The monthly sales for each product category show that Electronics sales reached a peak in April and Home Appliances in March. Sports sales reached the highest values in February, then again in April. They all decreased until August. The sales for Clothing, Books and Beauty Products remained almost constant for all the months.
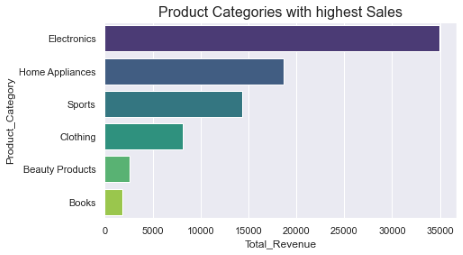
Which product categories have the highest sales?
The highest sales come from Electronics, followed by Home Appliances and Sports, while Clothing, Beauty Products, and Books make up for smaller proportions.
Which product categories are most popular in each region?
The heatmap shows that the highest sales volume comes from Electronics in North America, followed by Home Appliances in Europe and Sports in Asia. Other popular products are Clothing in Asia, Beauty Products in Europe and Books in North America.
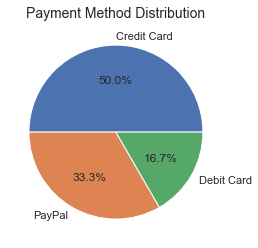
What is the distribution of payment methods?
The highest revenue comes from using Credit Cards (50%), followed by PayPal(33.3%) and Debit Card (16.7%). The most used payment method in North America is Credit Card, followed by Europe where is mostly used PayPal. Asia is the only region where are used two payment methods, Credit and Debit Cards.